
What Is Root Cause Analysis in Security Incidents?
HuntRule Team · · 9 min read
On this page
At 09:14 a user typed their password into a page that looked like the corporate SSO portal. By 10:47, 4,214 files had been read from \\FS01\Finance. The report that names the phishing email as the root cause is the report that changes nothing.
The walkthrough below is a reconstruction we built to teach the method, not a case we worked. Every event ID, field name and rule string in it is real. The victim is not.
The trap
Root cause analysis in security has one failure mode that shows up in nearly every first draft: the initial access vector gets promoted to root cause. Phishing link, exposed RDP, unpatched edge device. Those are entry points. They are the first thing the timeline records, which is not the same as the thing that made the outcome possible.
Ask what the entry point actually explains. It explains how the adversary got a foothold. It does not explain why one credential was enough, why a workstation could open port 445 to a file server, or why the alert that fired at 09:21 was closed at 09:27. Each of those is a separate decision made months earlier by someone who is not in the room.
A reconstructed intrusion
The chain, with the artifact that would record each step:
09:14 credential harvested via a link in email (
T1566.002).09:21 sign-in to the VPN portal with the harvested credential from an unfamiliar ASN (
T1078). The identity provider raises a risky sign-in alert.09:27 the alert is closed as a false positive. It is the 41st unfamiliar-location VPN alert that week and the previous 40 were sales staff on the road.
09:33 the VPN issues an address on the user VLAN.
net view \\FS01enumerates shares (T1135). Security event 5140 on FS01 records the share connection.09:41 to 10:47 bulk reads of
\\FS01\Financeover SMB (T1021.002,T1039). Security event 5145 records each access check.
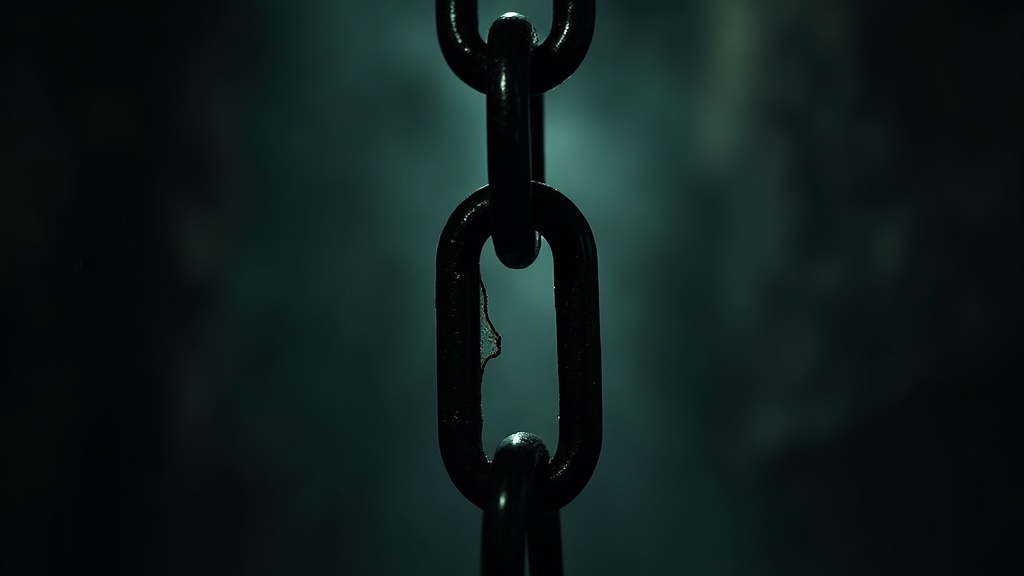
Three facts about this chain matter more than the phishing email. The VPN portal was carved out of the conditional access MFA policy eighteen months earlier for a legacy client that no longer exists. The user VLAN routes to the server VLAN with no filtering on 445. And the risky sign-in queue had a 96 percent historical false positive rate, so closing it fast was the rational local behaviour.
Where five whys breaks
Five whys came out of Toyota. Sakichi Toyoda developed it and Taiichi Ohno, the architect of the Toyota Production System, described it as the way to trace a defect back past its symptoms. It is genuinely useful and it is the wrong shape for this incident.
Run it and watch what happens:
Why did finance data leave?      The attacker read \\FS01\Finance.
Why could they read it?          They authenticated as jdoe.
Why did they have jdoe's creds?  jdoe entered them on a phishing page.
Why did jdoe do that?            The page was a copy of the SSO portal.
Why was it convincing?           The attacker copied the real one.
Root cause: user fell for phishing.
Five whys produced a single thread and terminated on a person. The absent MFA never appears, because the chain never branched toward identity. The flat network never appears, because it never branched toward routing. The closed alert never appears at all. Toyota's own people have criticised the technique for arbitrary shallowness, and this is that criticism in security clothing: one why-chain models one cause, and most intrusions have several necessary ones.
Fishbone, and the counterfactual test
Ishikawa's cause-and-effect diagram fixes the branching problem. Kaoru Ishikawa created it while building quality management at the Kawasaki shipyards, and it was popularised in the 1960s. The point is the spine with ribs: you commit up front to examining several categories, so no single narrative can swallow the analysis. For intrusions the categories that earn their place are identity, network, detection, endpoint, process and data.
Fishbone gives you candidates. It does not rank them. For that, use the counterfactual test on each candidate: if this one thing had been different and nothing else had changed, does the chain break?
MFA enforced on the VPN portal. The chain breaks at 09:21.
User VLAN filtered from the server VLAN on 445. The chain breaks at 09:33.
Bulk-read detection on FS01. The chain breaks at 09:45, before most of the collection.
Phishing email blocked at the gateway. The chain breaks at 09:14, and breaks again next month when a different lure gets through.
Three of those are independently sufficient. That is the honest finding: several necessary causes, several controls that each would have been enough. Not one root.
The test works on system state. It fails on people. Asking "what if the analyst had escalated" imports knowledge the analyst did not have at 09:27, which is how you arrive back at a first-story finding.
Blameless is not a courtesy
The reliability world adopted blameless postmortems for a reason that applies directly here. Fear-driven analysis produces "user error" and stops, and "user error" is the least actionable finding in the catalogue. From Behind Human Error, quoted in Etsy's write-up of the practice:
Human error is seen as the effect of systemic vulnerabilities deeper inside the organization.
Practically: the analyst who closed the alert at 09:27 has the only account of what that queue looked like at 09:00. If the writeup is going to name them, that account never arrives, and the 96 percent false positive rate stays invisible. Blameless framing is how you get the input, not a way of being polite about the output.
The output that matters
A finding without a control is a paragraph. Pair each cause with the control that would have broken the chain, and for a detection audience at least one of those controls has to be a detection, because prevention that depends on a project plan takes a quarter and detection ships this week.
Cause: VPN portal excluded from the MFA conditional access policy. Control: remove the exclusion. Owner: identity. Preventive.
Cause: user VLAN reaches server VLAN on 445 unfiltered. Control: ACL between the two, allow-list the print and file paths that genuinely need it. Owner: network. Preventive.
Cause: no alert on bulk reads of sensitive shares. Control: the Sigma correlation below. Owner: detection engineering. Detective, and the only one of the three that survives the next unknown initial access vector.
Cause: risky sign-in queue at 96 percent false positives. Control: tune the source before adding anything to the queue. Owner: detection engineering. Detective.
Detecting the collection step
Every step before 09:41 used valid credentials and no malware. Collection is where the behaviour stops looking like a user. Windows event 5145 fires under the Audit Detailed File Share subcategory every time a network share object is checked for access, and it carries ShareName, RelativeTargetName, IpAddress and AccessMask.
title: File access on a monitored sensitive share
name: monitored_share_file_access
id: 6b2a4c1e-0d5f-4a83-9c17-2e4d8b7f1a30
status: experimental
description: Base event for detailed file share access on servers hosting sensitive shares.
references:
    - https://learn.microsoft.com/en-us/windows/security/threat-protection/auditing/event-5145
author: HuntRule
date: 2026-07-31
tags:
    - attack.collection
    - attack.t1039
logsource:
    product: windows
    service: security
    definition: 'Requirements: Advanced audit policy Object Access > Audit Detailed File Share must be enabled for Success on the file server. This subcategory is high volume.'
detection:
    selection:
        EventID: 5145
        ShareName|endswith:
            - '\Finance'
            - '\HR'
            - '\Legal'
    filter_machine_accounts:
        SubjectUserName|endswith: '$'
    filter_local:
        IpAddress:
            - '-'
            - '::1'
            - '127.0.0.1'
    condition: selection and not 1 of filter_*
falsepositives:
    - Service accounts that do not end in a dollar sign
level: informational
---
title: Bulk read of a sensitive share by a single account
id: c4f0d9b7-31a6-4e52-8b0c-7a19d3e6f245
status: experimental
description: One account generating more than 200 access checks against a monitored share within ten minutes, modelling mass collection before exfiltration.
correlation:
    type: event_count
    rules:
        - monitored_share_file_access
    group-by:
        - SubjectUserName
        - IpAddress
    timespan: 10m
    condition:
        gte: 200
tags:
    - attack.collection
    - attack.t1039
    - attack.t1021.002
falsepositives:
    - Backup agents and DLP or search indexers running under user accounts
    - A user copying a project folder to a laptop before travel
    - Migration jobs using robocopy
level: high
What the rule catches and misses
It catches the shape of collection: one identity, one source address, hundreds of objects, ten minutes. That shape holds whether the credential arrived by phishing, password spray or a stolen session cookie, which is exactly why the detection outlives the entry point that produced this particular incident.
What it misses, plainly. It misses an operator who paces reads under the threshold, and a patient adversary will. It misses shares outside the ShareName list, so the list is now a thing you have to maintain. It misses everything if Audit Detailed File Share is not enabled, and it is off by default. It sees access checks, not files, so a client that checks the same object more than once inflates the count. And ShareName in 5145 is logged in the form \\*\Finance, with a literal asterisk in place of the server name, which is why the rule uses endswith rather than an exact match.
We have not benchmarked 200 events per ten minutes against a real file server. Take a week of your own 5145 volume, plot the per-account distribution and set the threshold above your indexers. Correlation rules also need a backend that supports them, currently Splunk SPL, Elasticsearch ES|QL, Loki, SQL and OpenSearch.
ATT&CK mapping
ID | Technique | Where it appears |
|---|---|---|
T1566.002 | Phishing: Spearphishing Link | 09:14 credential harvest |
T1078 | Valid Accounts | 09:21 VPN sign-in |
T1135 | Network Share Discovery | 09:33 |
T1021.002 | Remote Services: SMB/Windows Admin Shares | 09:33 SMB session to FS01 |
T1039 | Data from Network Shared Drive | 09:41 to 10:47 bulk reads |
Summary
The initial access vector is the first symptom, not the root cause. Five whys will hand you a single-thread story ending in "user error" unless you force the analysis to branch, which is what fishbone categories are for. Rank the branches with the counterfactual test, applied to system state rather than to what someone should have known at the time. Then write the output as cause and control pairs, with at least one detection among them, because the detection is the only control that still works against the entry point you have not seen yet.
Collect these on any server holding data worth taking:
5140  A network share object was accessed          (Audit File Share)
5145  A network share object was checked for access (Audit Detailed File Share)
4624  An account was successfully logged on         (LogonType 3 for SMB)
4625  An account failed to log on
Rules that fire on lateral movement and collection over SMB live under /rules?domain=windows, and the identity-side coverage that would have broken this chain at 09:21 is under /rules?domain=identity. If you are still assembling the process that produces these writeups, start with /blog/what-is-incident-response.
Related articles
What Is a Lessons Learned Session in IR?
Two lines came out of the same incident. The first: "improve communication with the network team." The second: "on-call had no out-of-hours route to network engineering, so the rota now lists a named…
2025-11-078 min read
What Is Post-Incident Review (PIR)?
NIST SP 800-61 Revision 2 lists nine questions for a lessons learned meeting. The last three are the only ones that point forward, and they are the ones teams skip. Corrective actions, precursors and…
2025-10-2310 min read
What Is an Incident Timeline in DFIR?
MFTECmd writes a column named SI<FN into its $MFT CSV. It holds a boolean. True means the $STANDARD_INFORMATION created time on that file is earlier than the $FILE_NAME created time, which on a file…
2025-09-2610 min read